
Red Tide Current Status
Daily Sample Map
This map contains the last eight days of sampling and is updated daily at 5 p.m.
Please be sure to click on individual dots for sampling details.
Red Tide Status Update for September 11, 2026
Recent genetic and toxin analyses confirmed that the bloom observed in Northeast Florida in prior weeks was composed of Karenia papilionacea, rather than Karenia brevis (the red tide organism). These two species can be difficult to distinguish using light microscopy alone, so genetic analysis was used to confirm the identification. Karenia papilionacea produces substantially less toxin than K. brevis (if any), and no brevetoxins were detected in Northeast Florida counties during this bloom. The daily sample map was updated with corrected data on September 2, 2026.
Current Conditions
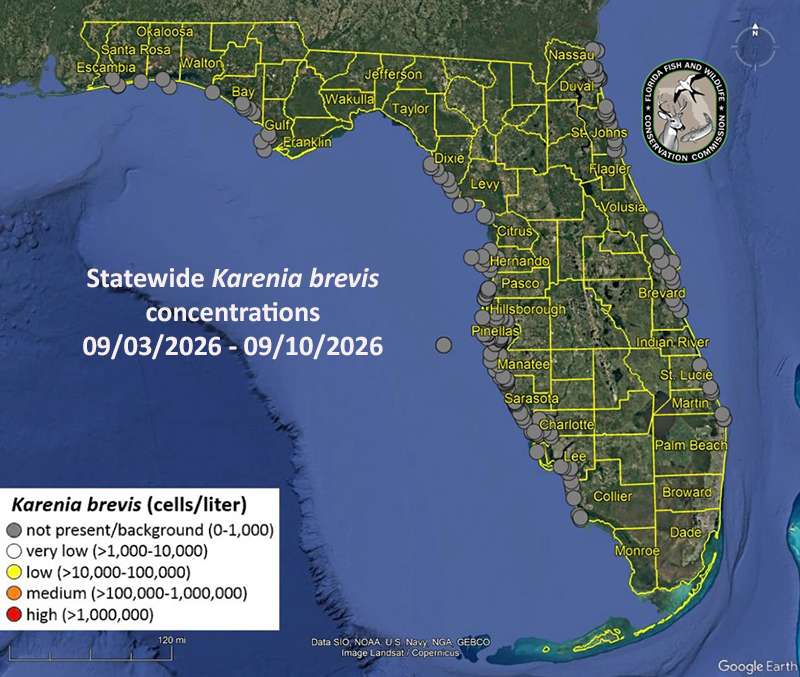
The red tide organism, Karenia brevis, was not observed in samples collected statewide over the past week. We continue to use satellite imagery (USF and NOAA NCCOS) to help track nearshore and offshore conditions.
For additional information please view:
• the Southwest Florida Coast report and map.
• the Northwest Florida Coast report and map.
• the Florida East Coast report and map.
Fish Kills
No fish kills suspected to be related to red tide were reported to FWC's Fish Kill Hotline or other partners over the past week.
Respiratory Irritation
Respiratory irritation suspected to be related to red tide was not reported over the past week. For forecasts that use FWC and partner data, please visit the National Oceanic and Atmospheric Administration’s Gulf Coast Harmful Algal Bloom Forecast.
Forecast
Short-term (3.5 day) forecasts by the USF-FWC Collaboration for Prediction of Red Tides predict net northwestern movement of surface waters from Pinellas to Charlotte Counties, with variable movement from Lee to northern Monroe counties. Variable subsurface water transport is predicted from Pinellas to northern Monroe counties over the next few days.
Statewide Red Tide Status Map (September 11, 2026)
The next status report will be issued on Friday, September 18. Please check our daily sampling map which can be accessed from the top of this page.
Latest Red Tide Status Report Available by Phone
Call 866-300-9399 at any time from anywhere to hear a recording about red tide conditions throughout the state. Standard calling charges apply.
Reports are updated on Friday afternoon except during holidays, in which case the report will be released on the closest day. Additional information, if available, is provided on Wednesday afternoon. To receive an e-mail when the current status has been updated, visit our subscription area.
Additional Information
For additional information about red tide, including information on how to report a fish kill or other wildlife effects, consult health authorities about human exposure, or locate other resources, visit our Red Tide-Related Hotlines and Information Sources page.
Archived status maps can be found in our Flickr gallery. Previous regional status reports and maps can be found on our red tide resources page.
Blue-Green Algae Bloom Information
Additional information regarding the current status of algal blooms in South Florida is being consolidated and posted on the Florida Department of Environmental Protection’s website: https://floridadep.gov/dear/algal-bloom.
Key for Results
| Description | K. brevis abundance | Possible effects (K. brevis only) |
|---|---|---|
| NOT PRESENT- BACKGROUND | background levels of 1,000 cells or less | no effects anticipated |
| VERY LOW | > 1,000 - 10,000 cells/L | possible respiratory irritation; shellfish harvesting closures when cell abundance equals or exceeds 5,000 cells/L |
| LOW | > 10,000 - 100,000 cells/L | respiratory irritation; shellfish harvesting closures; possible fish kills; probable detection of chlorophyll by satellites at upper range of cell abundance |
| MEDIUM | > 100,000 - 1,000,000 cells/L | respiratory irritation; shellfish harvesting closures; probable fish kills; detection of surface chlorophyll by satellites |
| HIGH | > 1,000,000 cells/L | as above, plus water discoloration |