
Plant Mapping
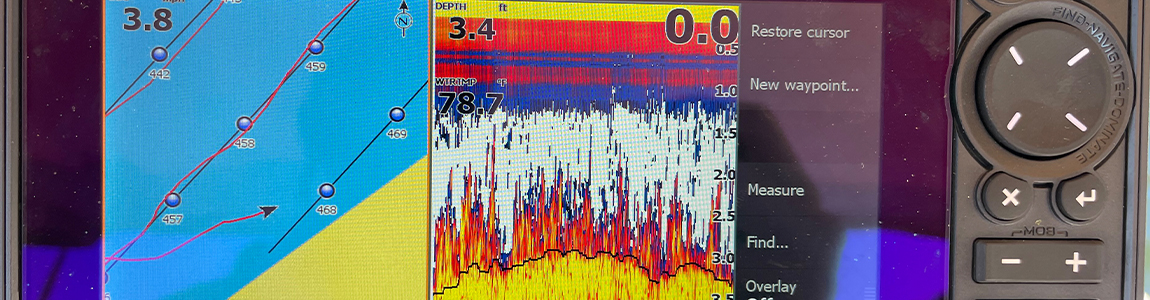

The Lake Vegetation Mapping Project of FWC’s Freshwater Fisheries Long Term Monitoring (LTM) Program began in 2015 with the objective of developing a long-term aquatic vegetation dataset to inform management and research actions and decisions on Florida’s freshwater lakes. Additionally, aquatic vegetation data could be used to correlate changes in freshwater fisheries population data already collected as part of FWC’s Freshwater Fisheries LTM Program. This project focuses on collecting data that creates whole lake estimates and maps of percent area covered (PAC) and percent volume infested (PVI) for submerged aquatic vegetation (SAV), and species-specific maps with density and occurrence estimates for all types of aquatic vegetation (i.e., submerged, emergent, and floating) encountered on a lake. Percent area covered (PAC) is defined as the overall surface area of a lake that has vegetation growing across the lake area mapped, and percent volume infested (PVI) is defined as the average percentage of a lake’s water column occupied by vegetation across the lake area mapped. A list of lakes for mapping is developed every year based on their monitoring, management, or research needs, with an average of 50 lakes mapped each year. Each lake is mapped during the summer growing season, with most lakes mapped between the months of May and October. An evenly spaced grid of transect lines and points is created for each lake that is typically orientated perpendicular to the lake’s longest shoreline, with grid spacing primarily a function of lake size. Boats equipped with a Lowrance® HDS sonar unit and transducer are used to record sonar data for mapping the presence or absence of submerged aquatic vegetation and the stems of any emergent vegetation present along all transect lines at a lake. BioBase LLC’s EcoSound™ web-based sonar data processing platform is then used to merge sonar data collected along transect lines into the areas between and outside the transect lines to create whole lake maps and estimates of SAV, PAC, and PVI. At each point along transect lines the boat is slowed down or stopped to allow for a vegetation rake to reach the bottom of the lake to allow for the sampling and recording of any vegetation or algae present on the rake and visually directly at each point. Between 2015 and 2025 this project has mapped vegetation at 144 unique lakes, with 13 mapped every year, and 82 mapped at least twice, which also includes the mapping of Kings Bay, Crystal River as the only non-lake system mapped. This project maps around 300,000 lake-acres every year and has driven greater than 40,000 miles while mapping over the 11 years of this project.
What's Happening on My Lake
Have you ever wondered when on your favorite lake or river, why is it the way it is? How is the fishing? Can you hunt on this lake? How deep is the water here? Are there any tournaments or festivals associated with a water body? What is happening on my lake? Well, wonder no more! Head this way to view an interactive map to answer these questions and more.